

Manual deployments are not error-prone. Moreover, they consist of a bunch of repetitive and complex tasks. The development teams are afraid of the complexity of deploying a new version of an application and the headaches it brings. Sometimes, deploying an application requires advanced platform skills. It is a tedious process to debug deployment issues.
FluxCD helps you to reduce the effort dedicated to manual and repetitive tasks. It also minimizes the deployment errors and human interactions. It offers tools to track and update the state of your deployments using declarative files, making the deployment and debugging process easier for your development teams.
This article explores the automation of your deployment processes to transform them into continuous deployment processes using FluxCD, Flagger, and Grafana.
Check the first article to learn more about continuously delivering an application:
CI/CD Hands-On: A Simple But Functional Continuous Integration Workflow [Part 1].
GitHub Example: https://github.com/joan-mido-qa/continious-deployment-example
Introduction
Use KinD and Terraform to set up the Kubernetes cluster. First of all, create the cluster and export the Kubernetes configuration to set the Kubernetes provider:
$ kind create cluster --name develop
$ kind export kubeconfig --name develop --kubeconfig kubeconfig
Create a new GitHub repository and a developer token with repository permissions, Terrafom requires it to setup FluxCD. Initialize Terraform and apply the changes:
$ terraform init
$ terraform apply -var="github_owner=owner_name" -var="github_repository=repo_name" # Introduce your GitHub token
Once Terraform finishes the installation process, you should have FluxCD running in your KinD cluster and a new folder named cluster in your repository.
Terraform
Under the hood, Terraform installs MetalLB and configures the IP range. You can read more about the MetalLB configuration in the first part of the article:
resource "helm_release" "metallb" {
  name = "metallb"

  repository = "https://metallb.github.io/metallb"
  chart      = "metallb"
}

data "docker_network" "kind" {
  name = "kind"
}

resource "kubectl_manifest" "kind-address-pool" {
  yaml_body = yamlencode({
    "apiVersion" : "metallb.io/v1beta1",
    "kind" : "IPAddressPool",
    "metadata" : { "name" : "kind-address-pool" },
    "spec" : { "addresses" : [replace(tolist(data.docker_network.kind.ipam_config)[0].subnet, ".0.0/16", ".255.0/24")] }
  })

  depends_on = [helm_release.metallb]
}

resource "kubectl_manifest" "kind-advertisement" {
  yaml_body = <<YAML
    apiVersion: metallb.io/v1beta1
    kind: L2Advertisement
    metadata:
        name: kind-advertisement
    YAML

  depends_on = [helm_release.metallb]
}
Then, it installs FLuxCD Helm Chart and configures the GitHub repository to use FluxCD:
resource "helm_release" "flux" {
  repository       = "https://fluxcd-community.github.io/helm-charts"
  chart            = "flux2"
  name             = "flux2"
  namespace        = "flux-system"
  create_namespace = true
  version          = "2.9.2"
}

resource "tls_private_key" "flux" {
  depends_on = [helm_release.flux]

  algorithm   = "ECDSA"
  ecdsa_curve = "P256"
}

resource "github_repository_deploy_key" "flux" {
  depends_on = [tls_private_key.flux]

  title      = "Flux"
  repository = var.github_repository
  key        = tls_private_key.flux.public_key_openssh
  read_only  = "false"
}

resource "flux_bootstrap_git" "this" {
  depends_on = [github_repository_deploy_key.flux]

  path = "clusters/develop"
Pre-commit Hook Suggestions:
- Terraform (https://github.com/antonbabenko/pre-commit-terraform):
- TFSec: Static analysis for Terraform to spot potential misconfigurations
- TFLint: Static format checker for Terraform
- Detect Secrets (https://github.com/Yelp/detect-secrets): Preventing new secrets from entering the code base.
FluxCD
FluxCD is a GitOps tool to keep a Kubernetes cluster with the latest source control changes (like Git repositories). Flux automates the deployment of new code.
Once Flux is running in the cluster, let’s see how it works. We will deploy ingress-nginx as an ingress provider. Flux does not enforce the project folder structure. You can configure it as you wish or follow your preferred standard.
Create a folder named base inside a folder named infrastructure. The base folder has the basic infrastructure configuration for all your clusters. Next, create a folder named ingress-nginx. Use the namespace name as the folder name.
---
apiVersion: v1
kind: Namespace
metadata:
  name: ingress-ngnix
---
apiVersion: source.toolkit.fluxcd.io/v1beta1
kind: HelmRepository
metadata:
  name: ingress-nginx
spec:
  interval: 2h
  url: https://kubernetes.github.io/ingress-nginx
---
apiVersion: helm.toolkit.fluxcd.io/v2beta1
kind: HelmRelease
metadata:
  name: ingress-nginx
spec:
  interval: 15m
  chart:
    spec:
      chart: ingress-nginx
      version: 4.7.1
      sourceRef:
        kind: HelmRepository
        name: ingress-nginx
      interval: 15m
---
apiVersion: kustomize.config.k8s.io/v1beta1
kind: Kustomization
namespace: ingress-ngnix
resources:
- namespace.yaml
- helmrepository.yaml
- helmrelease.yaml
Use multiple files to define your objects: helmrelease.yaml, helmrepository.yaml, namespace.yaml, kustomization.yaml, etc.
The Kustomization reads and processes the resources to apply them. Last but not least, you need to create a Kustomization object to synchronize your cluster configuration. Create a YAML file named infrastructure.yaml inside the cluster/cluster_name folder:
Flagger
Flagger is a Kubernetes operator that delivers progressively your application using blue/green deployments, canary release, or A/B testing.
You can use the base folder to install your stack into all your clusters or use a different one to customize your installation depending on the cluster. For example, we want to install Flagger only into the development cluster.
Create a new folder using your cluster name inside the infrastructure folder. Then, create a file named infrastructure.yaml into your cluster/cluster_name:
---
apiVersion: kustomize.toolkit.fluxcd.io/v1
kind: Kustomization
metadata:
  name: infra-cluster-name
  namespace: flux-system
spec:
  dependsOn:
  - name: infra-base
  interval: 1h
  retryInterval: 1m
  timeout: 5m
  sourceRef:
    kind: GitRepository
    name: flux-system
  path: ./infrastructure/cluster_name
  prune: true
FluxCD will synchronize the cluster status after applying the infra-base Kustomization. Install Flagger, creating the following YAML file inside the infrastructure/cluster_name/flagger-system folder:
---
apiVersion: v1
kind: Namespace
metadata:
  name: flagger-system
---
apiVersion: source.toolkit.fluxcd.io/v1beta2
kind: HelmRepository
metadata:
  name: flagger
spec:
  interval: 1h
  url: https://flagger.app
---
apiVersion: helm.toolkit.fluxcd.io/v2beta1
kind: HelmRelease
metadata:
  name: flagger
spec:
  interval: 1h
  install:
    crds: CreateReplace
  upgrade:
    crds: CreateReplace
  chart:
    spec:
      chart: flagger
      version: 1.x.x
      interval: 6h
      sourceRef:
        kind: HelmRepository
        name: flagger
---
apiVersion: helm.toolkit.fluxcd.io/v2beta1
kind: HelmRelease
metadata:
  name: flagger-loadtester
spec:
  interval: 1h
  chart:
    spec:
      chart: loadtester
      version: 0.x.x
      interval: 6h
      sourceRef:
        kind: HelmRepository
        name: flagger
---
apiVersion: kustomize.config.k8s.io/v1beta1
kind: Kustomization
namespace: flagger-system
resources:
- namespace.yaml
- helmrepository.yaml
- helmrelease.yaml
Continuous Deployment
To build the Podinfo application continuous deployment pipeline, create the installation YAML file into the apps/cluster_name/podinfo*:*
---
apiVersion: v1
kind: Namespace
metadata:
  name: podinfo
---
apiVersion: source.toolkit.fluxcd.io/v1beta2
kind: HelmRepository
metadata:
  name: podinfo
spec:
  interval: 5m
  url: https://stefanprodan.github.io/podinfo
---
apiVersion: helm.toolkit.fluxcd.io/v2beta1
kind: HelmRelease
metadata:
  name: podinfo
spec:
  releaseName: podinfo
  chart:
    spec:
      chart: podinfo
      version: 6.5.0
      sourceRef:
        kind: HelmRepository
        name: podinfo
  interval: 50m
  install:
    remediation:
      retries: 3
  values:
    ingress:
      enabled: true
      className: nginx
    hpa:
      enabled: true
---
apiVersion: kustomize.config.k8s.io/v1beta1
kind: Kustomization
namespace: podinfo
resources:
- namespace.yaml
- helmrepository.yaml
- helmrelease.yaml
You can use the update hosts Python script to update your local environment hosts, as explained in the first part of the article.
Then, create the Kustomization file into the cluster/cluster_name folder to synchronize your apps:
---
apiVersion: kustomize.toolkit.fluxcd.io/v1
kind: Kustomization
metadata:
name: apps
namespace: flux-system
spec:
interval: 10m0s
dependsOn:
- name: infra-cluster-name
sourceRef:
kind: GitRepository
name: flux-system
path: ./apps/cluster_name
prune: true
wait: true
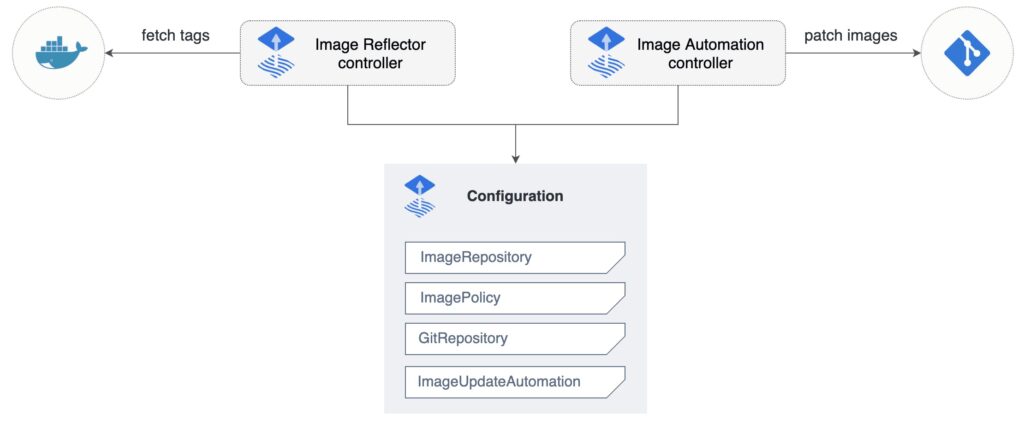
timeout: 5m0sNext, we can configure FluxCD to auto-update the Podinfo image Helm Chart version. To configure the image auto-update, we need to create an image repository to scan for new image tags, an image update policy to define the version pattern to update, and an image auto-update to configure the repository to push the change.
---
apiVersion: image.toolkit.fluxcd.io/v1beta2
kind: ImageRepository
metadata:
  name: podinfo-chart
spec:
  image: ghcr.io/stefanprodan/charts/podinfo
  interval: 5m
---
apiVersion: image.toolkit.fluxcd.io/v1beta2
kind: ImagePolicy
metadata:
  name: podinfo-chart
spec:
  imageRepositoryRef:
    name: podinfo-chart
  policy:
    semver:
      range: 6.x.x
---
apiVersion: image.toolkit.fluxcd.io/v1beta1
kind: ImageUpdateAutomation
metadata:
  name: podinfo-chart
spec:
  interval: 30m
  sourceRef:
    kind: GitRepository
    name: flux-system
    namespace: flux-system
  git:
    checkout:
      ref:
        branch: main
    commit:
      author:
        email: fluxcdbot@users.noreply.github.com
        name: fluxcdbot
      messageTemplate: 'chore(develop): update podinfo chart to {{range .Updated.Images}}{{println .}}{{end}}'
    push:
      branch: main
  update:
    path: ./apps/cluster_name/podinfo
    strategy: Setters
---
apiVersion: kustomize.config.k8s.io/v1beta1
kind: Kustomization
namespace: podinfo
resources:
[...]
- imagepolicy.yaml
- imagerepository.yaml
- imageautoupdate.yaml
Finally, apply the image update policy to the image or tag you want to update:
apiVersion: helm.toolkit.fluxcd.io/v2beta1
kind: HelmRelease
metadata:
  name: podinfo
spec:
  releaseName: podinfo
  chart:
    spec:
      chart: podinfo
      version: 6.5.0 # {"$imagepolicy": "podinfo:podinfo-chart:tag"}
      sourceRef:
        kind: HelmRepository
        name: podinfo
  interval: 50m
  install:
    remediation:
      retries: 3
Whenever Podinfo Chart has a new version in the range of 6.x.x, FluxCD will push a commit to the repository, updating the current version with the newer one.
First, create a metric template to let Flagger know which is the application status. We use Prometheus to measure the request success rate:
---
apiVersion: flagger.app/v1beta1
kind: MetricTemplate
metadata:
  name: podinfo-request-success-rate
spec:
  provider:
    type: prometheus
    address: http://loki-stack-prometheus-server.loki-stack:80
  query: |
    100 - sum(
        rate(
            http_requests_total{
              app_kubernetes_io_name="podinfo",
              namespace="{{ namespace }}",
              status!~"5.*"
            }[{{ interval }}]
        )
    )
    /
    sum(
        rate(
            http_requests_total{
              app_kubernetes_io_name="podinfo",
              namespace="{{ namespace }}",
            }[{{ interval }}]
        )
    ) * 100
---
apiVersion: kustomize.config.k8s.io/v1beta1
kind: Kustomization
namespace: podinfo
resources:
[...]
- metrictemplate.yaml
Then, define the canary release process. We use nginx as the provider to shape the incoming traffic. Flagger offers multiple ways and tools to configure your releases.
---
apiVersion: flagger.app/v1beta1
kind: Canary
metadata:
  name: podinfo
spec:
  provider: nginx
  targetRef:
    apiVersion: apps/v1
    kind: Deployment
    name: podinfo
  ingressRef:
    apiVersion: networking.k8s.io/v1
    kind: Ingress
    name: podinfo
  autoscalerRef:
    apiVersion: autoscaling/v2beta2
    kind: HorizontalPodAutoscaler
    name: podinfo
  progressDeadlineSeconds: 60
  service:
    port: 9898
    targetPort: 9898
  analysis:
    interval: 10s
    threshold: 10
    maxWeight: 50
    stepWeight: 5
    metrics:
    - name: podinfo-request-success-rate
      thresholdRange:
        min: 99
      interval: 1m
    webhooks:
    - name: acceptance-test
      type: pre-rollout
      url: http://flagger-loadtester.flagger-system/
      timeout: 30s
      metadata:
        type: bash
        cmd: curl -sd 'test' http://podinfo-canary.podinfo:9898/token | grep token
    - name: load-test
      url: http://flagger-loadtester.flagger-system/
      timeout: 5s
      metadata:
        cmd: hey -z 1m -q 10 -c 2 http://podinfo-canary.podinfo:9898/healthz
---
apiVersion: kustomize.config.k8s.io/v1beta1
kind: Kustomization
namespace: podinfo
resources:
[...]
- canary.yaml
Flagger requires the references to your deployment, ingress, and pod auto-escaler. Whenever Flagger detects a new version, it will scale up the deployment, create a primary and secondary service, and configure nginx to send the incoming traffic to the corresponding service. Use the maxWeight and stepWeight properties to configure the maximum traffic redirection percentage and incremental step percentage.
Load-test your application using Flagger hooks. It has multiple hooks. The acceptance hooks check the canary deployment readiness, and the load test hook generates constant incoming traffic.
Flagger will monitor the canary release status using the pre-defined success rate metric to decide the canary deployment promotion case. Flagger expects a 99% request success rate to promote the canary deployment. Use the threshold property to configure a maximum number of failed metric checks before rollback.
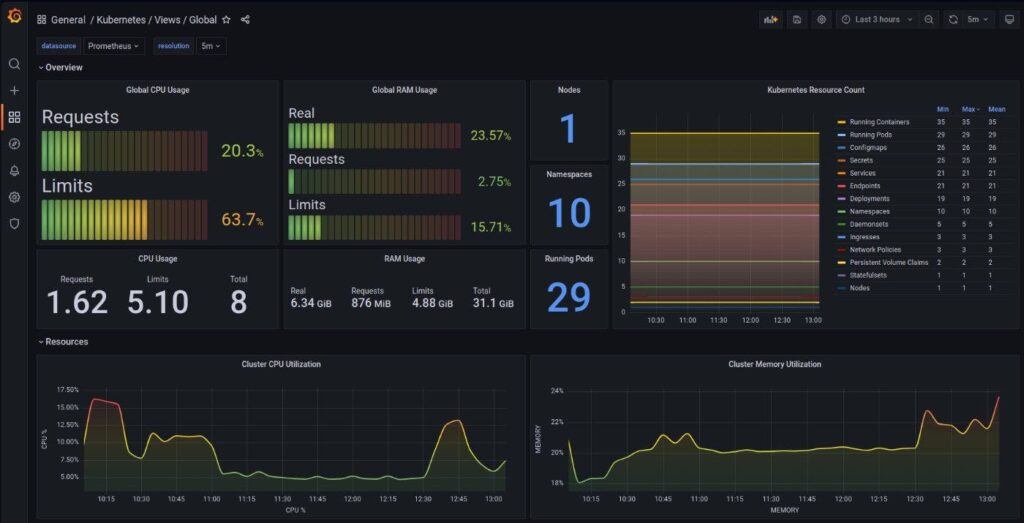
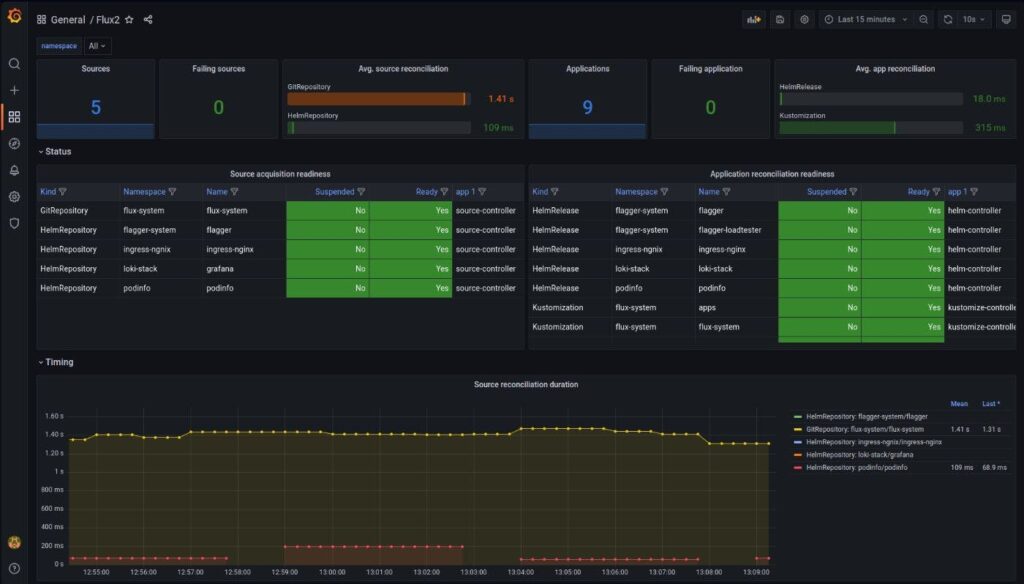
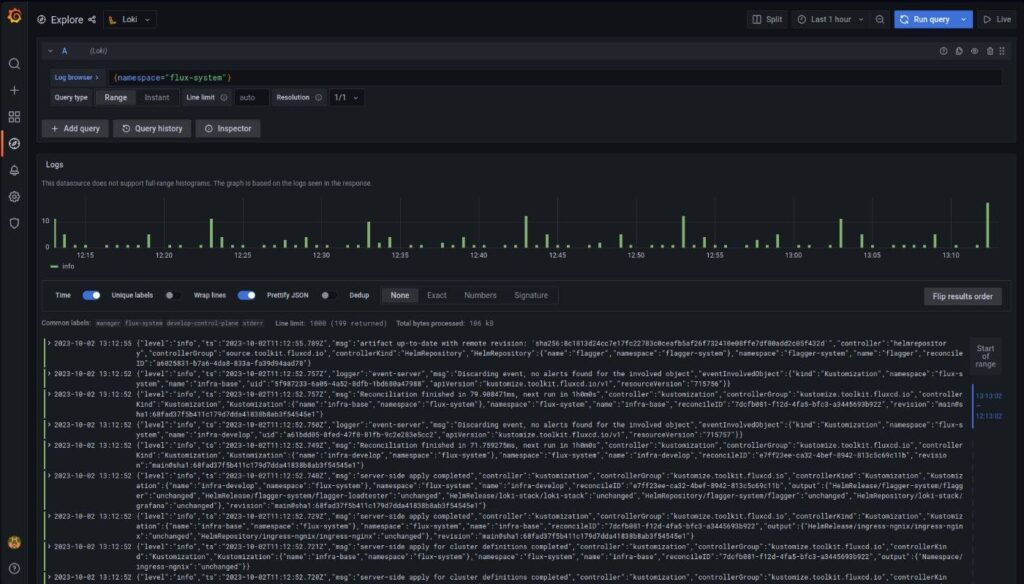
Monitoring
Use Loki stack to monitor the status of the cluster resources using Grafana + Loki + Prometheus. Install the Loki stack by creating the following YAML file inside the infrastructure/cluster_name/loki-stack folder:
---
apiVersion: v1
kind: Namespace
metadata:
  name: loki-stack
---
apiVersion: source.toolkit.fluxcd.io/v1beta1
kind: HelmRepository
metadata:
  name: grafana
spec:
  interval: 2h
  url: https://grafana.github.io/helm-charts
---
apiVersion: helm.toolkit.fluxcd.io/v2beta1
kind: HelmRelease
metadata:
  name: loki-stack
spec:
  interval: 1h
  chart:
    spec:
      chart: loki-stack
      version: v2.9.11
      sourceRef:
        kind: HelmRepository
        name: grafana
      interval: 1h
  values:
    grafana:
      enabled: true
      ingress:
        enabled: true
        annotations:
          kubernetes.io/ingress.class: nginx
        hosts:
        - grafana.local
    prometheus:
      enabled: true
      nodeExporter:
        enabled: true
---
apiVersion: kustomize.config.k8s.io/v1beta1
kind: Kustomization
namespace: loki-stack
resources:
- namespace.yaml
- helmrepository.yaml
- helmrelease.yaml
The Loki stack installation enables the Grafana Ingress to access Grafana, Prometheus to gather your environment metrics, and Node Exporter to export your node metrics.
You can use the update hosts Python script to update your local environment hosts, as explained in the first part of the article
Log into Grafana using the admin username and password. You can define the admin password using the installation values. By default, the Chart creates a Kubernetes secret to store a random password. Describe the secret to get the base64 password value and decode it.
You can import your favorite dashboard using their ID or copying the raw JSON:
Conclusion
The first article explored how to deliver a well-tested application. This article explores how to continuously deploy a deliverable and monitor the status of the deployment.
FluxCD and Flagger offer multiple features to continuously test, deploy, and monitor your application status. This article uses some of them, but we did not see the webhooks and notifications features. Use the notifications features to know when a deployment failed or the web-hooks feature to promote the deployment to a new environment or launch your tests against new versions. Integrate FluxCD alongside other tools to enrich your deployment pipeline.
Avoid manual deployments. They are complex and not error-prone. Encourage the development teams to maintain their applications, making easier the deployment process. Automatic deployments reduce the lead time, feedback loop, and overall costs. Developers can focus on what really matters.


