

Nowadays, End-to-End testing of functional and non-functional requirements is a must but is time-consuming and can be solved using multiple tools and approaches. This article explores how to test the performance of an IoT system using Locust and Azure.
Defining the test scope and requirements is essential to maximize the value of the obtained results. Focusing on the metrics with a higher ROI is crucial (Those that are easily measurable and have a high value for the development team). The metrics are objective measurements of the system performance and dependent variables of:
- Infrastructure configuration (Cluster Nodes, CPU, Memory, Replicas, etc.)
- EventHub configuration (TU, nº of partitions, consumer groups, etc.)
- Solution architecture scalability and endurance
The performance tests help us to understand how the systems behave under a defined load: telemetries sent by a device per second multiplied by the number of total devices. The testing scope is the IoT platform and the Azure EventHub integration (It’s not a goal testing the IoT device). The key metrics to measure the solution performance are:
- EventHub events ingestion delay time (ms)
- Events loss rate (%)
Tools and Infrastructure
Locust
Locust is a Python performance tool that officially supports the HTTP/HTTPS protocol, but the developer can extend it to test any protocol or system. Users can wrap the protocol or system library and trigger Locust events after each request to inform Locust about the status of the test.
Wrapping the Paho-MQTT library is one of the solutions to test the MQTT protocol and IoT systems. Locust has some plugins which extend the supported protocols and systems :
Azure Container Instance
Azure Container Instances offers an easy way to configure, deploy and run multiple auto-managed containers. It’s an on-demand service that allows you to run any container using the cloud.
Azure EventHub
An Azure EventHub is a scalable data ingestion service managed by Azure. Azure products can consume the outgoing messages to analyze them and then report the analysis on a dashboard (Streaming Analytics and PowerBI). Moreover, Azure developed multiple EventHub SDKs to consume the outgoing events and implement your business logic.
Technical Approach
The article’s goal is to have an overview of the overall solution implementation and architecture. A detailed technical explanation is out of the scope. To know more about the implementation, use the following link to review the source code of the solution:
The repository contains an example of the framework to test the IoT system performance using Locust.
Deploy
Each container (Locust master/workers and Consumer) can be easily deployed using the Azure GitHub Action: aci-deploy. An alternative to GitHub Actions is Terraform. You can define your testing infrastructure using a Terraform plan and apply it using a GitHub workflow.
The master node has attached a file share (Azure Storage Accounts) to save the test tun logs and HTML reports.
The action can be triggered automatically by any GitHub event or manually by a user. Using the GitHub UI the user can define the test inputs: run time, spawn rate, number of users, etc. The deployed number of worker nodes depends on the number of devices (~500 devices per worker)
The Consumer also uses the aci-deploy action. A user can deploy the Consumer defining the container name, azure region, EventHub name, connection string, and consumer group.
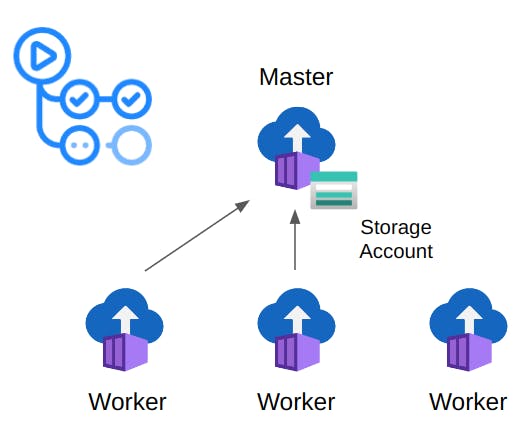
ACI Architecture
Performance Test
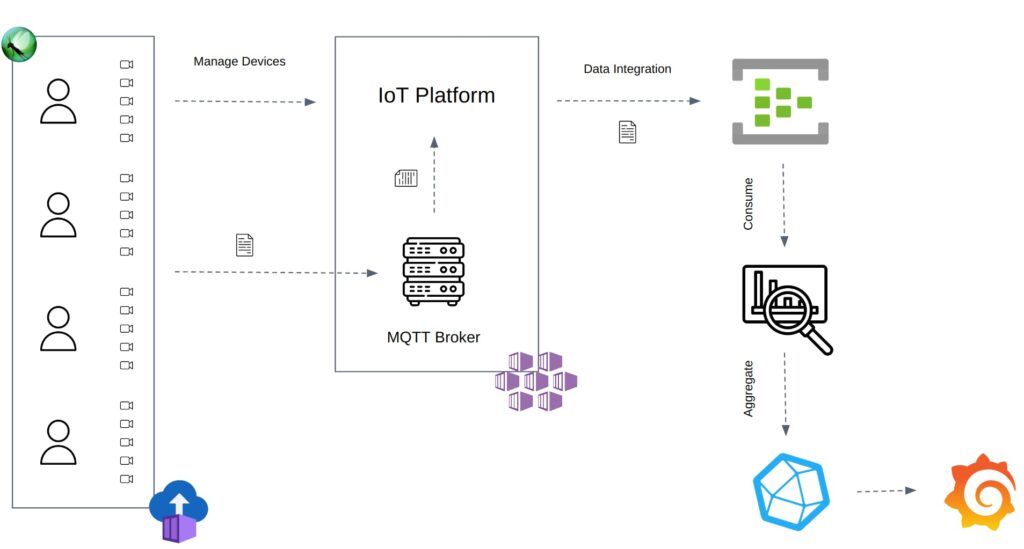
IoT systems use the MQTT protocol. Devices can publish telemetries about a topic using the MQTT broker. Then subscribers can choose a topic to subscribe to and receive telemetries from the subscription. In this case, the IoT platform receives and processes the telemetries sent by the devices to ingest them into the EventHub. To End-to-End test the system, the approach uses Locust to connect multiple IoT devices to the MQTT broker and publish telemetries with a constant throughput. The EventHub receives the telemetries from the IoT platformer once processed. Finally, the EventHub Consumer reads the outgoing telemetries to aggregate the received events count and the ingestion delay time.
Host CPU and Memory limits the maximum number of users per Locust instance (~500-750 users). Locust can run in distributed mode to overcome these limitations and spawn thousands of users. The test uses Azure Container Instances to run the Locust master/workers and the events Consumer. The events Consumer reads the EventHub outgoing messages and dumps the aggregated measurements into the InfluxDB.
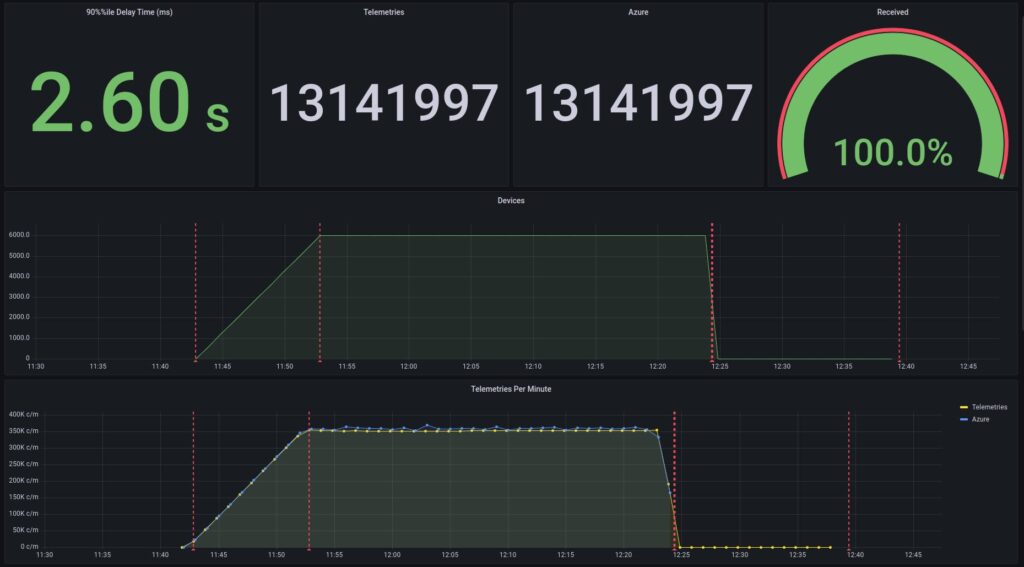
Last, Grafana plots and displays the performance results using InfluxDB data. InfluxDB calculates the total telemetries count, telemetries per minute, and nth% percentile delay time using the aggregated data from the Consumer.
Metrics
1. Event Ingestion Delay Time (ms)
The ingestion delay time is measured as the event enqueue time minus the event sent time. Locust adds a timestamt to each telemetry sending it.
2. % of Lost Telemetries:
Received Events / Sent Telemetries
Reports
Locust uses a self-developed InfluxDB plug-in to report the number of devices and telemetries (Explaining the plug-in implementation is out of the scope of this article). InfluxDB calculates each metric using Flux, INfluxDB query language.
Grafana is not only used to visualize and analyze the performance results but to also monitor the system infrastructure: Cluster CPU, Memory, Node, Pods, etc.
Implemented Solutions
Documenting the overall solution and the problems faced during the development phase helps to understand the solution architecture and the technical decisions. The section goal is discussing the issues faced during the development and the implemented solution.
Number of Events
Consuming a certain number of events per minute, aggregate the statistics, and dumping them into the database is not a straightforward task. One of the requirements of the test was to support a load of 340k events per minute. It’s not only the events number but also the events size. To overcome the vast amount of outgoing data the following solutions were implemented:
- Use multiple consumers to read from different EventHub partitions.
- Avoid dumping all the events into the database. The consumer aggregates the data by the number of events received per delay time. Each row has a UUID to avoid overriding the data rows when dumped into the InfluxDB.
| Enqueue Time | Delay Time | Count | uuid |
|---|---|---|---|
| 20:00:00 | 1000 | 5 | 704b496b-… |
| 20:00:00 | 1050 | 2 | 704b496b-… |
| 20:01:00 | 1000 | 10 | 704b496b-… |
| 20:01:00 | 950 | 7 | 704b496b-… |
- InfluxDB aggregates the data before displaying it on Grafana:
# 95% Delay Time Percentile

getFieldValue = (tables=<-, field) => {
    extract = tables
        |> map(fn: (r) => ({ r with _value: r._value * 95 / 100 }))
        |> findColumn(fn: (key) => key._field == field, column: "_value")

    return extract[0]
}

total = from(bucket: "")
  |> range(start: v.timeRangeStart, stop: v.timeRangeStop)
  |> filter(fn: (r) => r["_measurement"] == "data")
  |> filter(fn: (r) => r["run_id"] == "$run_id")
  |> filter(fn: (r) => r["_field"] == "count")
  |> drop(columns: ["uuid", "delay_ms"])
  |> sum()
  |> getFieldValue(field: "count")

from(bucket: "")
  |> range(start: v.timeRangeStart, stop: v.timeRangeStop)
  |> filter(fn: (r) => r["_measurement"] == "data")
  |> filter(fn: (r) => r["run_id"] == "$run_id")
  |> filter(fn: (r) => r["_field"] == "count")
  |> keep(columns: ["delay_ms", "_value"])
  |> sum()
  |> group()
  |> map(fn: (r) => ({ r with delay_ms: int(v: r.delay_ms) }))
  |> sort(columns: ["delay_ms"])
  |> cumulativeSum(columns: ["_value"])
  |> filter(fn: (r) => r._value < total)
  |> last()
  |> keep(columns: ["delay_ms"])

# Number of Telemetries per Minute

from(bucket: "")
  |> range(start: v.timeRangeStart, stop: v.timeRangeStop)
  |> filter(fn: (r) => r["_measurement"] == "data")
  |> filter(fn: (r) => r["run_id"] == "$run_id")
  |> filter(fn: (r) => r["_field"] == "count")
  |> drop(columns: ["uuid", "delay_ms"])
  |> window(every: 1m)
  |> sum()
  |> group()

# Number of Telemetries

from(bucket: "")
  |> range(start: v.timeRangeStart, stop: v.timeRangeStop)
  |> filter(fn: (r) => r["_measurement"] == "data")
  |> filter(fn: (r) => r["run_id"] == "$run_id")
  |> filter(fn: (r) => r["_field"] == "count")
  |> drop(columns: ["uuid", "delay_ms"])
  |> sum()
Number of Devices per Worker
Paho-MQTT uses the `select(..)` method, which depends on the FD_SETSIZE variable (FD_SETSIZE limits the number of open files). Python compilation uses a fixed FD_SETSIZE=1024. Each MQTT client opens three files per connection: 3 * 340 = 1020. Each worker has a limit of ~250 – 300 devices because Locust also opens a file per user. To spawn 6k devices, Azure needs to run 24 containers.
Running a high number of workers increases the error probability. In rare cases, the workers can’t successfully set up the environment or connect to the master making the test fail on start. To increase the number of devices per worker and make the test error-prone the following solution was implemented:
- Use a shell script to increase the open files soft limit and run locust as the container entry point:
ulimit -Sn 10000
- Override the MQTT client `_loop(..)` to use Python selectors instead of select. Selectors use the method that best fits your OS:
import selectors

class MqttClient(Client):
    [...]
    def _loop(self, timeout: float = 1.0) -> int:
        if timeout < 0.0:
            raise ValueError("Invalid timeout.")

        sel = selectors.DefaultSelector()

        eventmask = selectors.EVENT_READ

        with suppress(IndexError):
            packet = self._out_packet.popleft()
            self._out_packet.appendleft(packet)
            eventmask = selectors.EVENT_WRITE | eventmask

        pending_bytes = 0
        if hasattr(self._sock, "pending"):
            pending_bytes = self._sock.pending()

        # if bytes are pending do not wait in select
        if pending_bytes > 0:
            timeout = 0.0

        try:
            if self._sockpairR is None:
                sel.register(self._sock, eventmask)
            else:
                sel.register(self._sock, eventmask)
                sel.register(self._sockpairR, selectors.EVENT_READ)

            events = sel.select(timeout)
        except TypeError:
            return int(MQTT_ERR_CONN_LOST)
        except ValueError:
            return int(MQTT_ERR_CONN_LOST)
        except Exception:
            return int(MQTT_ERR_UNKNOWN)

        socklist: list[list] = [[], []]

        for key, _event in events:
            if key.events & selectors.EVENT_READ:
                socklist[0].append(key.fileobj)

            if key.events & selectors.EVENT_WRITE:
                socklist[1].append(key.fileobj)

        if self._sock in socklist[0] or pending_bytes > 0:
            rc = self.loop_read()
            if rc or self._sock is None:
                return int(rc)

        if self._sockpairR and self._sockpairR in socklist[0]:
            socklist[1].insert(0, self._sock)
            with suppress(BlockingIOError):
                # Read many bytes at once - this allows up to 10000 calls to
                # publish() inbetween calls to loop().
                self._sockpairR.recv(10000)

        if self._sock in socklist[1]:
            rc = self.loop_write()
            if rc or self._sock is None:
                return int(rc)

        sel.close()

        return int(self.loop_misc())
Conclusions
Data is crucial to make informed decisions. That’s the reason why testing is essential to solve a known problem. Testing allows us to understand the current status of the product regarding a specific requirement and helps us to decide which are the following steps.
Define the output metrics depending on the resulting technical value. Avoid measuring costly and low-technical value metrics to not add noise to your performance analysis. Avoid developing an overengineered solution by setting a clear test scope and correctly gathering the performance requirements from the development and product teams. It’s better to test a specific requirement and have fast feedback loops than trying to test all the possible scenarios and not having enough feedback.
The system performance depends on the product infrastructure design and architecture. Different infrastructure configurations can lead to totally different results. Testing the system helped us to understand how it behaves depending on the incoming events load and to focus on the bottlenecks. The analysis of the results served as guidance to have well-defined infrastructure requirements to optimally run the system under a specific load.


